viewtab
 In a previous post I showed
 csvsql which is one program in my arsenel of TSV/CSV file handling tools. Today’s post highlights another tool, viewtab, which is a fast read-only spreadsheet for exploring data in tab files. I often get data files from scientists or from the supplements of journal papers with only a vague clue what is in the file. I can cat the file but if the file has many columns a simple cat quickly becomes illegible. There are fancier things you can do with cat such as:
cat test.csv | column -s, -t | less -#2 -N -S
This gives you formatted columns that you can scroll through, but I find it clunky. Importing into spreadsheets often simply fails for the sized datasets I’m working with (i.e. 50,000 rows by 1500 columns) and tends to be slow and sometimes not easy to invoke from the command line.
I wrote viewtab to address these issues. viewtab is a fast read-only spreadsheet that can be invoked from the command line. viewtab is bundled with durbinlib, along with csvsql and an number of other very useful scripts.
Installation
The easiest way to install the library is to clone durbinlib, build it with ant, and then add the scripts directory to your path and the jar directory to your classpath, like:
git clone git://github.com/jdurbin/durbinlib.git
cd durbinlib
ant install
export PATH=$PATH:pathtodurbinlib/scripts/
export CLASSPATH=pathtodurbinlib/target/jar/*
I highly recommend that you set an environment variable to give Groovy/Java the option to use a lot of RAM:
export JAVA_OPTS='-Xmx3000m'
durbinlib requires fairly recent versions of Java,Groovy, and Ant. All other dependencies are bundled into the Git repository.
Usage
viewtab is invoked from the command line like this:
viewtab vijver2012_expression.csv
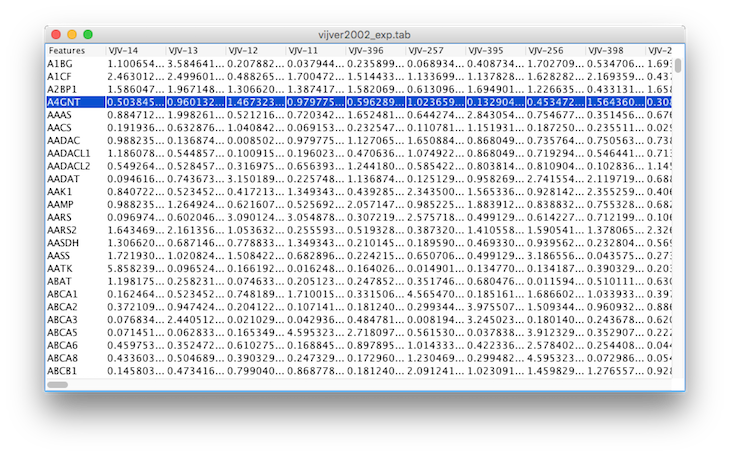
For this 9803 x 296 file of gene expression values, Apple’s Numbers takes 3 seconds to launch, 3-4 seconds for me to find the file in the file dialog, tries to load it for about 7 seconds, and finally tells you the file is too big and simply gives up. Running viewtab on this files takes 6 seconds to load and display. Even better, both vertical and horizontal scrolling are lag free.
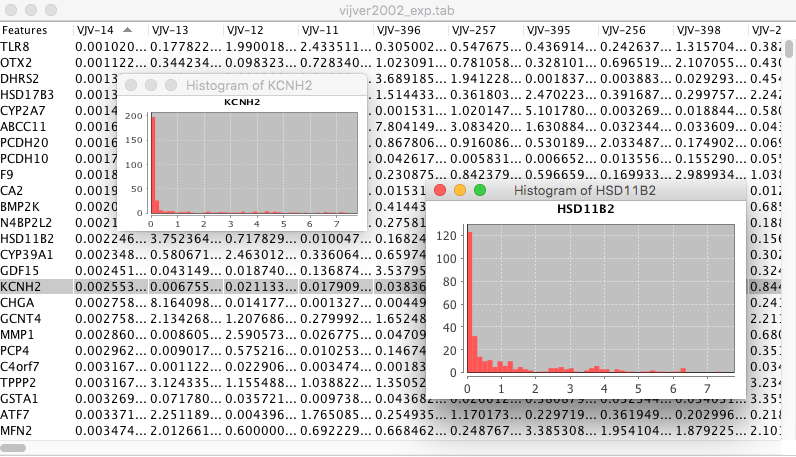
viewtab allows you to select a row or column (with right-click menu) and get a histogram of that row or column or a scatter plot of two different rows. For example, here is viewtab showing two histograms:

The resulting charts can have a custom title and axis labels, can be scaled or axis adjusted, and the results can be saved to a file or printed.
Viewtab source
To illustrate how easy it is to hack together a GUI app with Groovy, below is the source for the first draft of viewtab (before adding plotting and other extras). durbinlib, in particular durbin.util.Table is required and bundled with the script. There are no other dependencies.
#!/usr/bin/env groovy

import groovy.swing.SwingBuilder
import javax.swing.JTable
import javax.swing.*
import javax.swing.table.AbstractTableModel;
import durbin.util.*

err = System.err

class TableModel extends AbstractTableModel{
  Table dt;

  TableModel(Table table){dt = table;}

  public String getColumnName(int col) {return(dt.colNames[col]);}
  public String getRowName(int row){return(dt.rowNames[row]);}
  public int getRowCount() { return(dt.rows())}
  public int getColumnCount() { return(dt.cols()) }
  public String getValueAt(int row, int col) {return(dt.get(row,col))}
  public Class getColumnClass(int c) {return(dt.get(0,c).getClass())}
  public boolean isCellEditable(int row, int col){return false;}
  public void setValueAt(Object value, int row, int col) {}
}

fileName = args[0]

// Crudely determine if it's a tab or csv file
new File(fileName).withReader{r->
  line = r.readLine()
  if (line.contains(",")) sep = ","
  else if (line.contains("\t")) sep = "\t"
  else {err.println "File does not appear to be a csv or tab file.";System.exit(1)}
}

dt = new Table(fileName,sep,bFirstRowInTable=true)

err.print "Creating gui table..."
dtm = new TableModel(dt)

swing = new SwingBuilder()
frame = swing.frame(title:fileName,defaultCloseOperation:JFrame.EXIT_ON_CLOSE){
  scrollpane = scrollPane {
    thetab = table(autoResizeMode:JTable.AUTO_RESIZE_OFF, autoCreateRowSorter:true){
      tableModel(dtm)
    }
  }
}
err.println "done."
frame.pack()
frame.show()